Data as of September 30, 2026 · By Kris Bashenow, CLHMS
Seven homes in Indianapolis’s Washington Township sold this quarter without a single day on the open market. Five of them closed between $2.35 million and $4.0 million, including a 1928 Crows Nest estate on Sunset Lane that sold for $4,000,000, or $797.13 per square foot. It went under contract before it ever reached active status. Elsewhere in the township, a 1996 estate listed at $5,400,000 has now been publicly marketed for 727 days.
Neither figure measures what the open market would pay. One price was set without competing buyers; the other has been tested for two years and not met. Between them sits the defining pattern of Q3 2026: five of the township’s nine sales above $2 million traded before reaching the open market, which leaves sellers, buyers and appraisers with only four exposed sales to price the next trophy home.
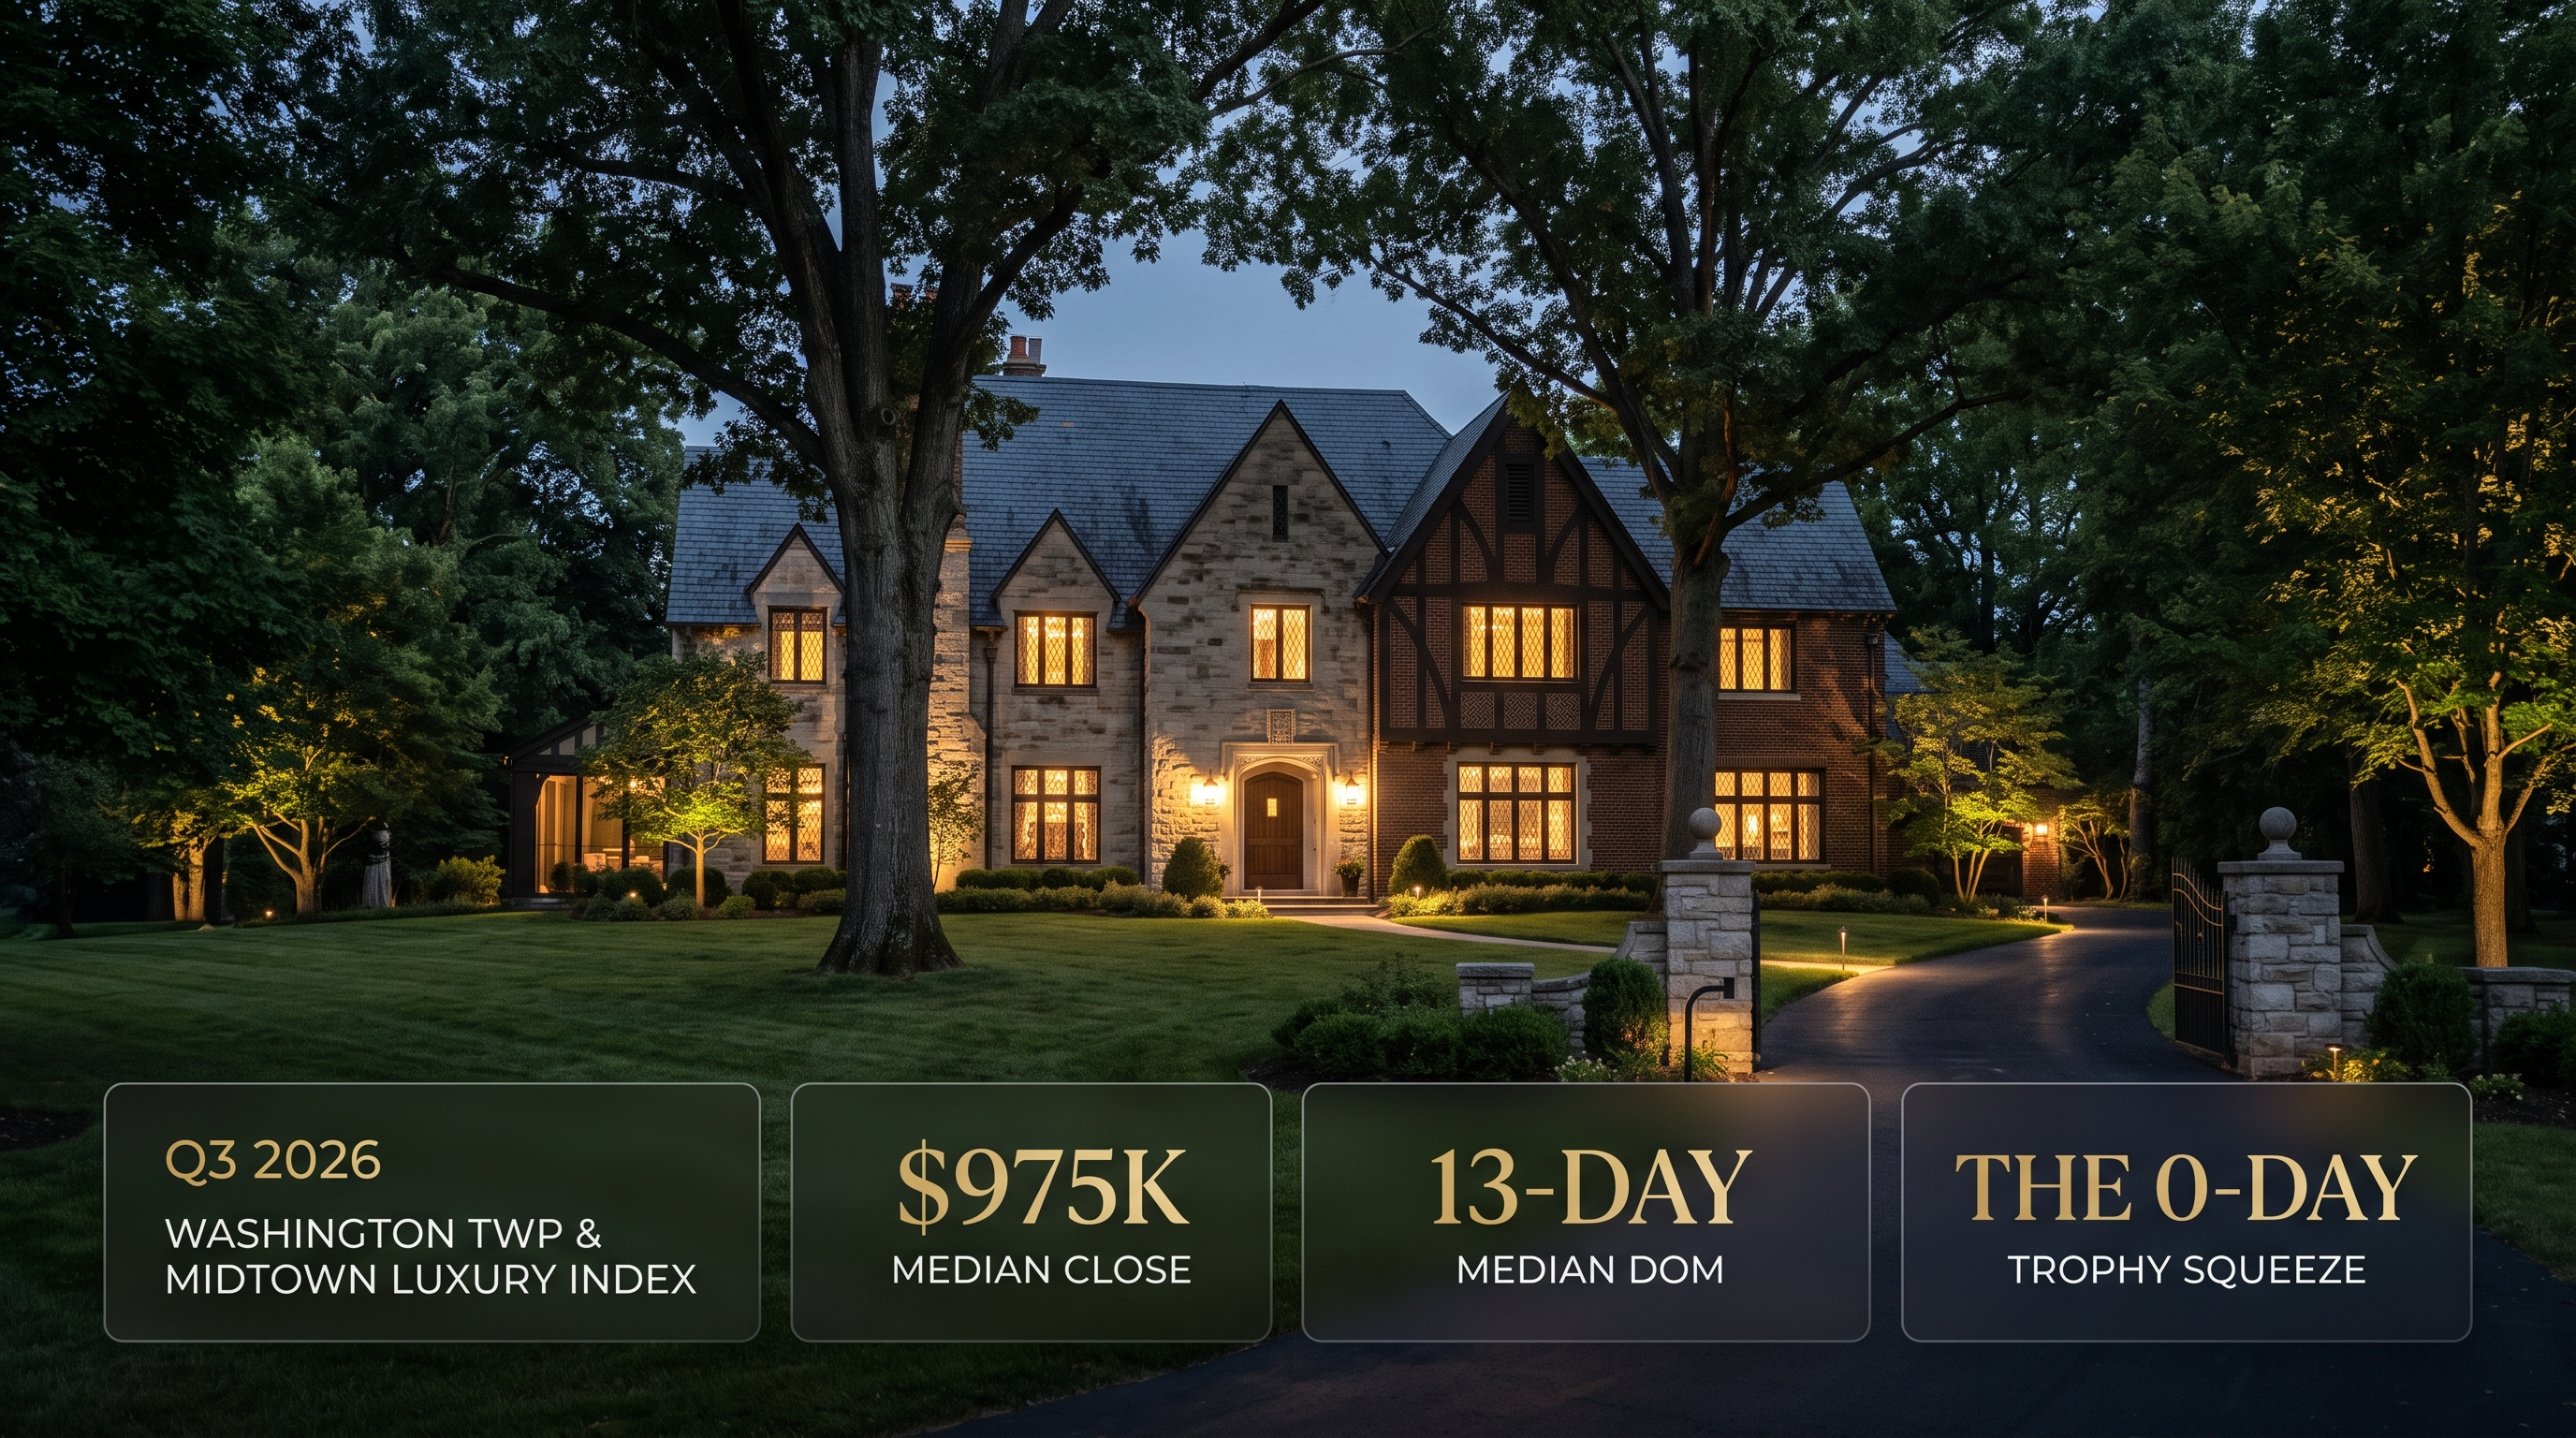
The Q3 2026 answer in brief: Washington Township (MIBOR area 4903) recorded 56 closed sales of $730,000 and above between July 1 and September 30, 2026. The median close price was $975,000, the median price per above-grade square foot was $326.65, and five of the nine sales above $2 million went under contract before reaching active status, with zero days on market.
Key Valuation Indicators: Q3 2026
| Indicator | Q3 2026 | Appraiser’s Eye & AI Note |
|---|---|---|
| Closed sales ($730K+) | 56 | Sales ranged from $730,000 to $4,000,000. |
| Median close price | $975,000 | Half of all sales closed below $1M; the middle of this market is a seven-figure threshold. |
| Average close price | $1,324,800 | Nine sales of $2M and above pull the average 36% above the median. |
| Median $/sq ft (main and upper levels) | $326.65 | Above-grade area only. The range ran from $192.92 to $871.18, a 4.5x spread. |
| Median days on market (sold) | 13 | BLC basis, which excludes the seven 0-day sales. Counting all 56 sales, the median is 10 days. |
| Sold at 0 days on market | 7 of 56 | Under contract before reaching active status, with no public marketing period. Five closed between $2.35M and $4.0M. |
| Aggregate sale-to-list ratio | 97.99% | Publicly marketed homes that went under contract within 7 days closed at 101.39%. No sale of $2M and above closed over asking. |
| Active listings ($725K+) | 36 | Asking prices from $725,000 to $7,995,000. |
| Active median days on market | 71 | Average 96 days. Active inventory has been exposed more than five times as long as the typical sold home. |
Source: MIBOR BLC® closed and active single-family residential listings, $725,000 and above, MIBOR area 4903, Q3 2026.
The 0-Day Illusion: Exclusivity vs. Untested Valuation
In Q3 2026, five of Washington Township’s highest-tier sales, ranging from $2.35M on Washington Boulevard to $4.0M on Sunset Lane, closed at a registered 0 Days on Market. Legacy brokerage marketing routinely celebrates these off-market transactions as the pinnacle of luxury real estate networking. But viewing these numbers through a disciplined appraisal lens reveals a far more dangerous financial reality.
Legacy agents call 0-day sales ‘exclusivity.’ An appraiser calls it untested valuation.
When a luxury estate liquidates quietly behind closed doors, price discovery never occurs. Without open-market exposure, both parties take on severe financial risk:
- The Seller’s Risk (An Untested Price): Accepting a quiet off-market offer removes the only test that shows whether a competing buyer would have paid more. The seller never learns what exposure would have produced.
- The Buyer’s Risk (Overpaying Without Grounding): Purchasing off-market deprives buyers of true market validation. Paying a premium price without verifying whether competing luxury buyers would support that exact dollar figure exposes the buyer to valuation regret when secondary appraisal reviews occur.
True luxury real estate marketing isn’t about selling quietly to a buddy over golf. It is about engineering maximum competitive tension through data-backed positioning, targeted executive outreach, and precision digital exposure before contract execution.
The $192 vs. $871 Valuation Spread
The same square foot of living space in Washington Township sold for anywhere from $192.92 to $871.18 this quarter. The top of that range, 8140 Sycamore Rd in Williams Creek Estates, was a 0-day trade that never reached the open market. Among publicly marketed homes, the range ran from $192.92 to $620.35, still a 3.2x spread.
At the low end, 8836 Crystal River Dr, a 2003 home with 3,784 above-grade square feet in Crystal Lake, sold for $730,000 after 2 days on market. At the top of the exposed range, 3777 Bay Road North Dr, a 1984 single-level home with 2,821 square feet in Nantucket Bay, sold for its $1,750,000 asking price after 4 days. The newer, larger house sold for less than half the price.
An appraiser explains that gap with three factors that never appear in a square-footage figure:
- Location provenance. Buyers pay for an established address in Williams Creek, Meridian Hills or Crows Nest, and that premium attaches to the land.
- Site and privacy. On estate lots, the house can represent a minority of total value. Spread across a modest footprint, land value lifts price per square foot sharply.
- Architectural era. Period homes with recognized design pedigree trade as scarce goods, which the next sections quantify.
Price per square foot works as a comparison tool only between homes with similar sites and similar provenance, and only when the sale was exposed to competing buyers. Above roughly $2.5M in this township, it often describes the land more than the house.
The Renovation Risk-Discount
Among the 49 publicly marketed homes, speed and price moved together. The 18 that went under contract within a week closed at 101.39% of list in aggregate, and 10 of them sold above asking. The 15 that took longer than 30 days closed at 95.47%, a gap of nearly six points.
The BLC report does not grade condition, and the slow group spans every building era, from 1908 to 2021. Age alone does not explain the discount; the fit between asking price and condition does. A buyer at $1M and above weighs a dated kitchen or original systems against the cost, time and uncertainty of a custom renovation, and prices that risk into the offer.
The penalty compounds at higher price points because the buyer pool narrows. A turn-key home removes the uncertainty and competes for every qualified buyer at once. An un-renovated home at the same price competes only with buyers willing to take on a project, and that smaller group negotiates harder.
Appraiser’s note: Condition shows up in appraisal through effective age, the age a home functions at after updates. Two 1950s houses on the same street can carry effective ages decades apart, and their values reflect it.
The 3 Architectural Eras of Midtown
Washington Township’s sales divide into three building eras, and the oldest commands the highest median price per square foot. Excluding the seven 0-day trades, the order holds: $343.56, $324.23 and $303.86.
| Era (year built) | Sales | Median $/sq ft | Median close | 0-day sales |
|---|---|---|---|---|
| Historic (before 1940) | 29 | $349.39 | $975,000 | 5 |
| Mid-century (1940 to 1979) | 16 | $326.52 | $949,950 | 1 |
| Modern (1980 and later) | 11 | $308.49 | $1,105,000 | 1 |
Historic, before 1940. Pre-war homes produced 29 of the 56 sales and five of the seven 0-day trades. The exposed sales carry the evidence: 5647 N Pennsylvania St (1934) closed at $591.38 per square foot after 1 day, 5320 N Meridian St (1932) at $540.12 after 4 days, and 4151 N Pennsylvania St (1923) at $533.86 after 18 days. Buyers competing in the open market paid a premium for period architecture on established streets. In Midtown, age is an asset when the provenance is right.
Mid-century, 1940 to 1979. This era holds the township’s ranch stock: seven single-level homes sold at a median of $328.82 per square foot and 6 days on market. It also holds the estate tier, where 7779 Ridge Rd (1970) closed at $3,800,000, or $521.98 per square foot, after 22 days, while 8140 Sycamore Rd posted the quarter’s highest price per square foot in a 0-day trade.
Modern, 1980 and later. Newer homes carry the lowest median price per square foot in the township, the reverse of Carmel’s Q3 pattern, where homes built since 2014 led. The headline exception, 7418 Washington Blvd (1997), closed at $3,970,000 in a 0-day trade, or $615.12 per above-grade square foot. That home also has 8,031 finished square feet below grade; across its 14,485 total square feet, the price works out to $274.08. Lower-level area is valued at a different rate, so the above-grade figure alone overstates its premium.
Three Positioning Strategies for $2M+ Sellers
Active listings in Washington Township have been on the market a median of 71 days, while the typical publicly marketed sale went under contract in 13. The quarter’s results point to three strategies.
- Price from provenance-matched comparables. Build the price from sales with the same era, the same caliber of street and a similar site. Township-wide price per square foot misleads at this level, and a price set above the provenance-matched range starts the clock toward the 96-day active average.
- Know what a private sale can and cannot prove. Appraisers define market value as the price a home brings after reasonable exposure to the open market. A sale arranged before the public sees the home offers speed and certainty, but it gives the seller no competitive test of price, and it carries less weight as a comparable for the next appraisal. The seven 0-day trades closed at 97.68% of list, and none closed above asking. If a private sale is on the table, make it a deliberate, disclosed choice under MLS rules, made with an independent view of what full exposure would likely produce.
- Remove renovation risk before pricing. Address condition items that a buyer would otherwise price as uncertainty, or price the home transparently as a renovation opportunity. Listings priced as turn-key when they are not fall into the long-marketed group that closed at 95.47% of list.
Methodology
All figures come from MIBOR BLC® single-family residential data for MIBOR area 4903 (Washington Township, Marion County): 56 sales of $730,000 and above closed July 1 through September 30, 2026, and 36 active listings of $725,000 and above. Era, price-tier and DOM segments are calculated from the individual transactions. A 0-day sale is one that went under contract before reaching active status, with no public marketing period; these sales are included in all-sales figures and separated wherever exposure matters. BLC days-on-market statistics exclude 0-day sales; figures that include them are labeled. Sale-to-list is aggregate close volume divided by aggregate list volume. Information is deemed reliable but not guaranteed.
Kris Bashenow, CLHMS, is a luxury real estate advisor with The DeBoor Group powered by Real Broker and a former high-value residential appraiser with Chubb.