Data as of September 30, 2026 · By Kris Bashenow, CLHMS
Executive Summary & Appraisal Perspective
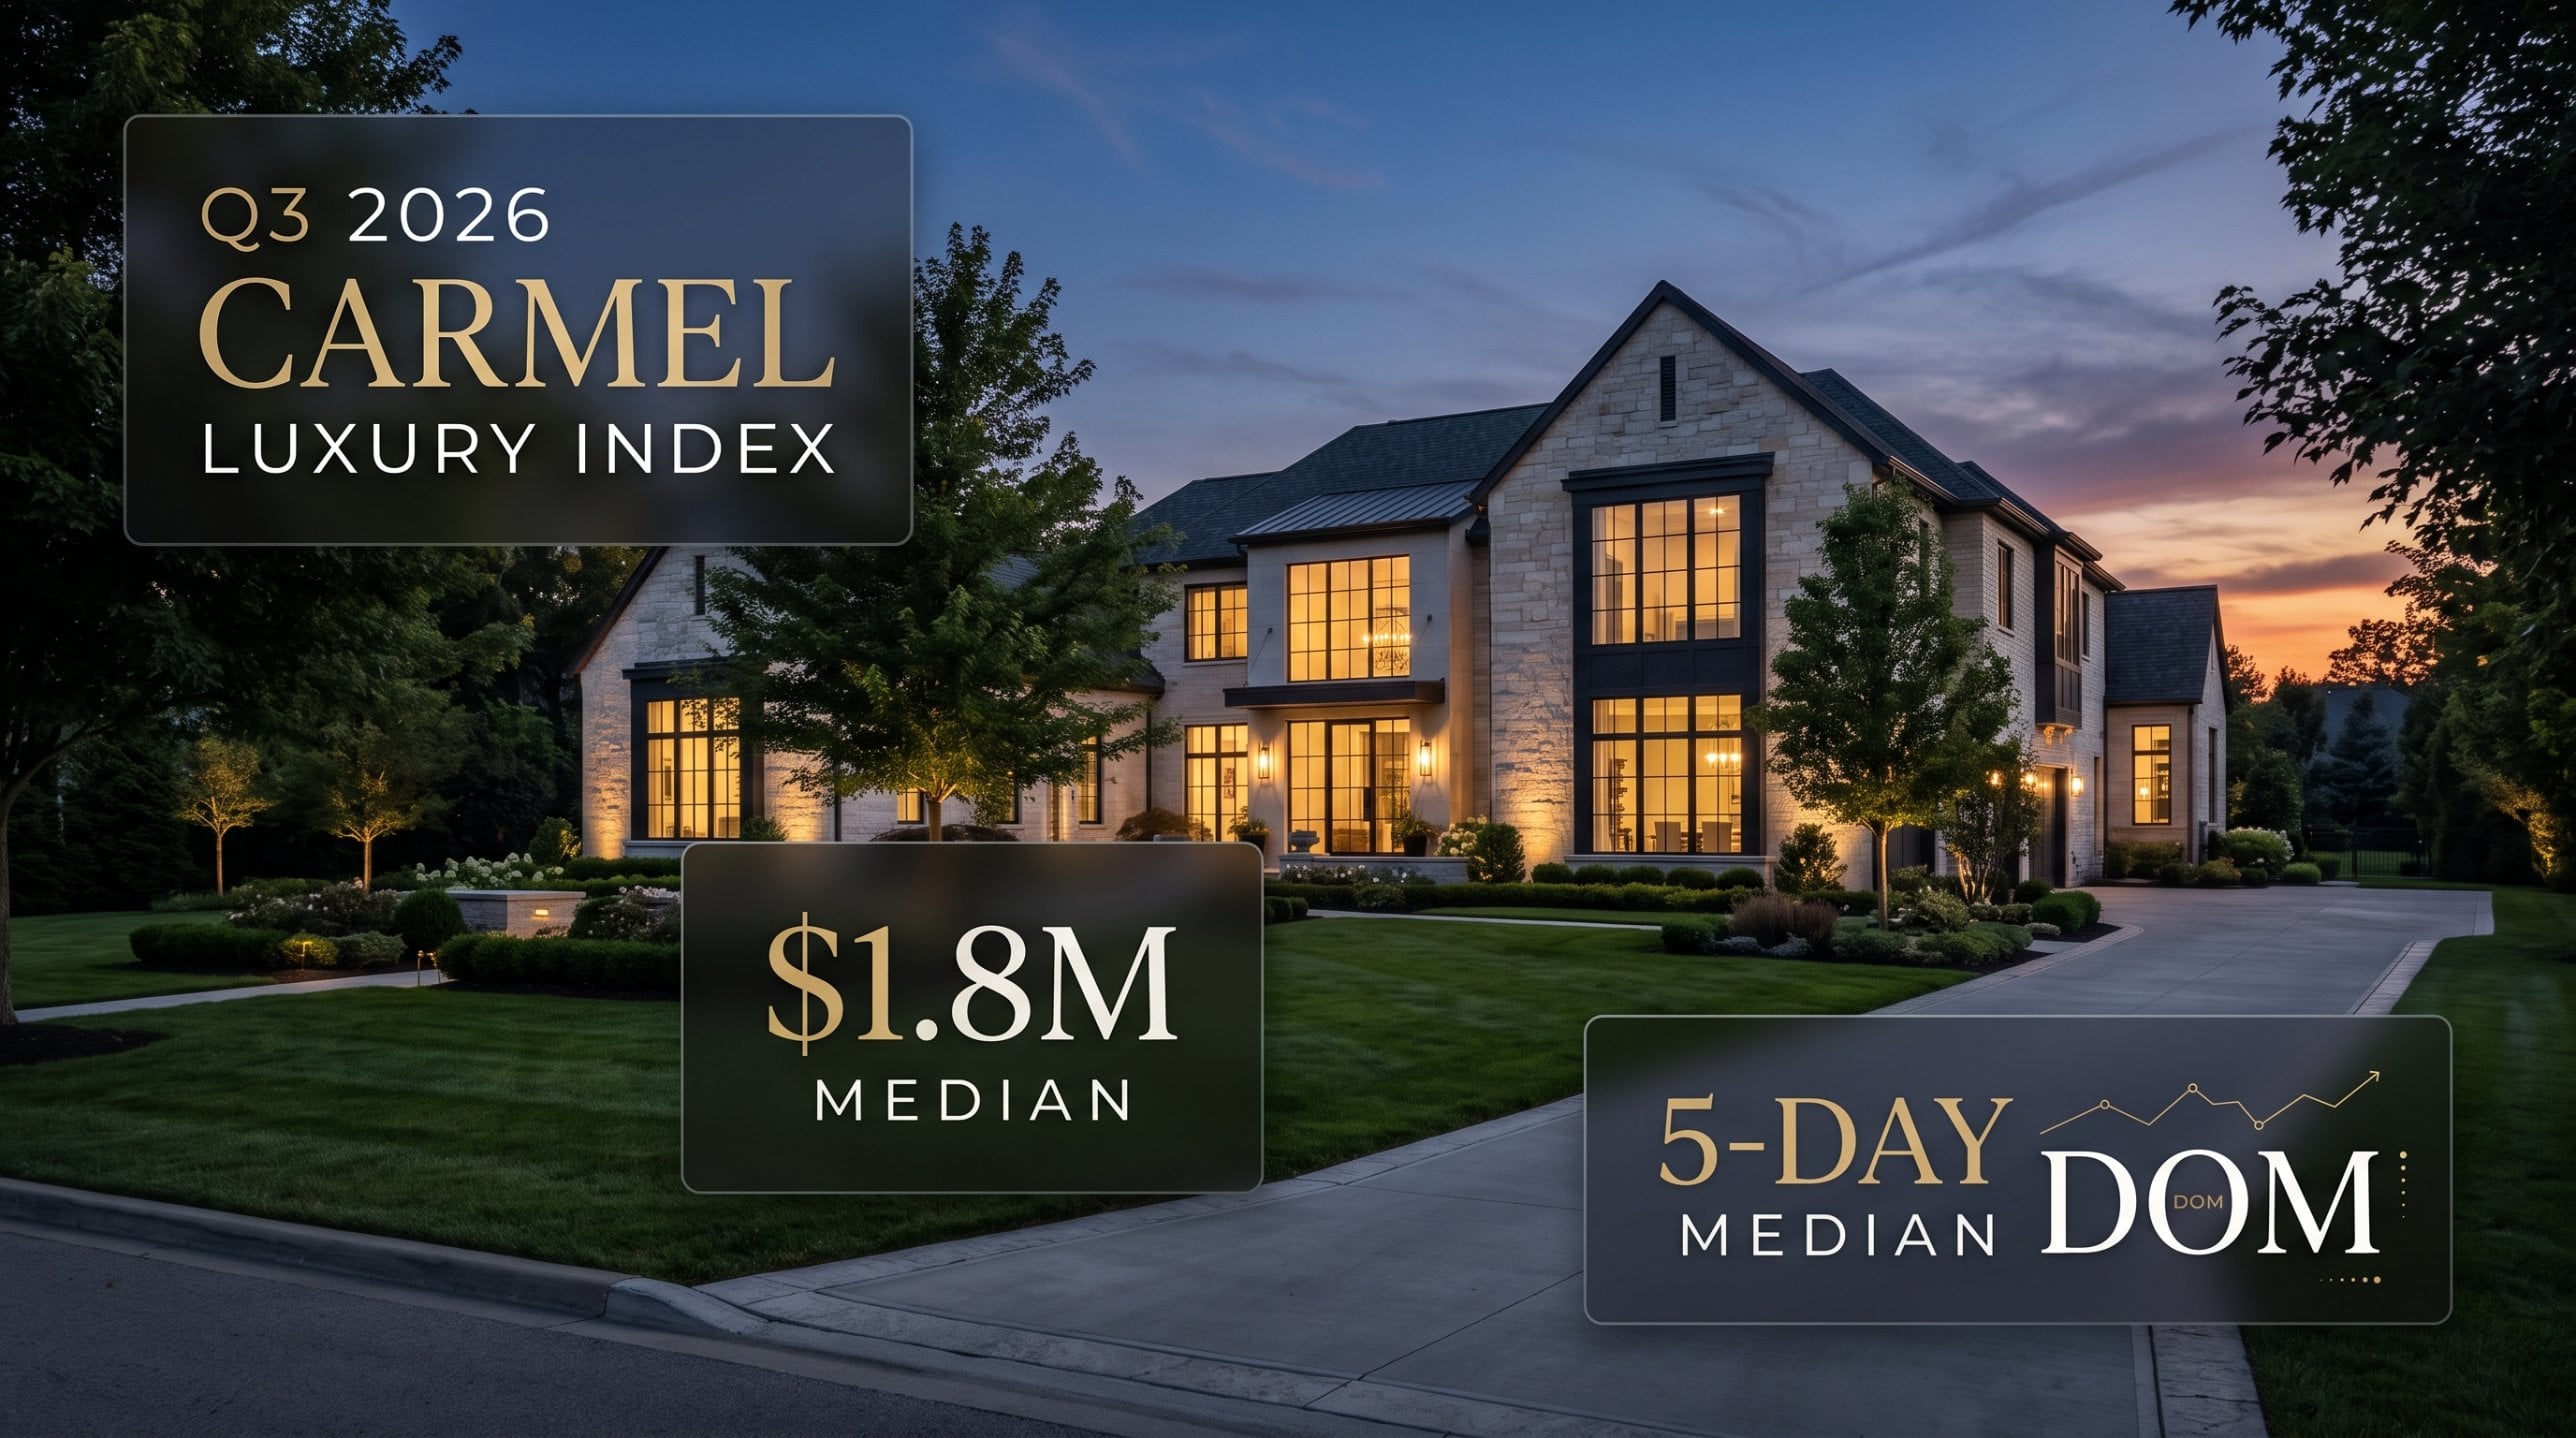
Carmel’s $1.5M+ segment recorded 26 closed sales between July 1 and September 30, 2026, at a median close price of $1,800,000 and a median of 5 days on market. Buyers paid 98.89% of aggregate list price across the quarter.
Those two figures describe a market that rewards accurate pricing quickly. Half of all $1.5M+ sales in Carmel went under contract in about five days, a pace that leaves sellers little room to test the market with an aspirational number.
The quarter’s averages blend two distinct outcomes:
- Priced to the market: 15 of 26 homes went under contract within 7 days. As a group they closed at 102.23% of list, and six of them sold above asking.
- Priced past the market: the remaining 11 homes stayed active longer than 7 days. As a group they closed at 95.41% of list, a gap of 6.8 points.
The spread between the 5-day median and the 21-day average comes from this second group. Two listings at 78 and 148 days pull the mean upward while the typical sale clears in under a week.
An appraiser reads this pattern as evidence that buyers in this segment are well informed and price-anchored. They act fast on homes that reconcile to recent comparable sales and wait out those that do not. The first week of market exposure functions as the market’s own appraisal of a listing.
Key Valuation Indicators: Q3 2026
| Indicator | Q3 2026 Value |
|---|---|
| Reporting period | July 1 to September 30, 2026 |
| Closed sales ($1.5M+) | 26 |
| Close price range | $1,500,000 to $4,250,000 |
| Median close price | $1,800,000 |
| Average close price | $1,965,225 |
| Average list price | $1,987,173 |
| Median close price per sq ft (main and upper levels) | $394.39 |
| Average close price per sq ft (main and upper levels) | $433.35 |
| Median days on market | 5 |
| Average days on market | 21 |
| Sale-to-list ratio (aggregate) | 98.89% |
| Sales closed at or above list | 12 of 26 |
Source: MIBOR BLC® closed residential sales, $1.5M and above, MIBOR areas 2910 and 2913. Price per square foot uses above-grade living area only; finished lower levels, which averaged 2,531 sq ft in this dataset, are excluded from the denominator.
Submarket Breakdown & Infill Analysis
Walkable infill in downtown Carmel carried the highest price per square foot of any location type in the quarter, at a median of $631.29, about 62% above the $388.92 median for the 24 subdivision and estate sales combined.
| Segment | Sales | Median $/sq ft | Median DOM | Sale-to-list |
|---|---|---|---|---|
| Walkable infill (781 1st Ave NW, 307 E Small St) | 2 | $631.29 | 105 | 94.88% |
| The Village of WestClay | 6 | $372.04 | 6.5 | 97.76% |
| All other subdivisions and estates | 18 | $388.92 | 4.5 | 99.67% |
| Full dataset | 26 | $394.39 | 5 | 98.89% |
781 1st Ave NW (built 2015, 2,901 sq ft) closed at $1,800,000, or $620.48 per sq ft. 307 E Small St (built 2016, 3,543 sq ft) closed at $2,275,000, or $642.11 per sq ft. Both are newer construction on compact downtown sites.
The premium has two sources. Buyers pay for walkability to downtown Carmel’s dining and retail core, and a scarce downtown site carries land value that stays roughly constant regardless of house size. Spread across a smaller above-grade footprint, that land value lifts the per-square-foot figure.
The buyer pool at this price point is narrow. These two homes needed 148 and 62 days and closed about 5% below list. The infill premium is real, but it is earned slowly, and list prices set above it get corrected.
The Village of WestClay produced the most sales of any single community (6), clustered at the entry of the segment with a median close of $1,562,430. The same size effect appears inside the community: 12855 Bird Cage Walk, at 3,025 sq ft, sold at $495.87 per sq ft in one day, while the larger homes closed between $309 and $414.
Two sales show where price per square foot stops working as a comparison tool:
- 532 Dorset Blvd (Springmill Streams, built 1981) closed at $2,261,000, 122% of its $1,849,900 list price, in 4 days. At $604.22 per sq ft on 3,742 sq ft, the price reflects site and location value well beyond the improvements.
- 13500 Six Points Rd (built 1989, single level) closed at $3,750,000, or $987.10 per sq ft. Value on a property like this sits in the land, and its per-square-foot figure says little about the house.
Bridgewater Club recorded 2 sales at opposite ends of the range: $1,900,000 for a 2006 home and $4,250,000 for a 2022 home at $593.00 per sq ft, the quarter’s top sale. Jackson’s Grant added 2 sales at $1,500,000 and $1,650,000, with Claybridge, Clay Corner, Springmill Streams and Bridlebourne rounding out the dataset.
Appraisal & Valuation Insights for $1.5M+ Sellers
Homes built from 2000 to 2013 were the slowest and most discounted vintage in Q3, with a 19.5-day median and a 96.15% sale-to-list ratio. Newer and older homes both sold faster.
| Year built | Sales | Median $/sq ft | Median DOM | Sale-to-list |
|---|---|---|---|---|
| 2014 to 2026 | 10 | $471.11 | 5.5 | 97.63% |
| 2000 to 2013 | 6 | $348.36 | 19.5 | 96.15% |
| Before 2000 | 10 | $352.55 | 4 | 101.71% |
Replacement cost sets the buyer’s benchmark. A buyer at $1.5M and above can usually choose between an existing home and building new. When the cost of land plus new construction runs high, newer turn-key homes absorb that demand at the top of the per-square-foot range, consistent with the $471.11 median for homes built since 2014.
Effective age drives the middle cohort. Homes from 2000 to 2013 are old enough that kitchens, baths and mechanical systems are approaching replacement, yet too new for land value to carry the price. Buyers in this group discount for the work ahead, and appraisers account for it through effective age and condition adjustments. The result shows up as longer marketing time.
Mature sites carry older homes. The pre-2000 cohort’s 101.71% ratio comes from established locations: Springmill Streams, Coppergate, Bridlebourne and Windemere all closed above list within 4 days. Buyers there are paying for the site.
New construction follows the same rules. 1537 Mairn Ave, completed in 2026, needed 32 days and closed at 91.5% of its $1,999,900 list. A new home priced above its comparables gets the same correction as a resale.
For sellers preparing a $1.5M+ listing in Carmel, the Q3 data supports four practices:
- Set the launch price from closed comparables of the same vintage and location type; the first 7 days carry the most negotiating leverage.
- Value finished lower levels separately. Appraisers reconcile above-grade area and below-grade area at different rates, so a large lower level does not raise the per-square-foot figure.
- Address visible condition items before listing in homes built from 2000 to 2013, where buyer discounts were steepest.
- On infill and land-driven properties, build the price from site value plus the contributory value of the improvements, and expect financed buyers’ appraisals above 105% of list to need strong comparable support.
Methodology
All figures come from MIBOR BLC® closed single-family residential sales of $1,500,000 and above in MIBOR areas 2910 and 2913, closed July 1 through September 30, 2026. Segment medians, cohort ratios and DOM splits are calculated from the 26 individual transactions. Sale-to-list is aggregate close volume divided by aggregate list volume. Information is deemed reliable but not guaranteed.
Kris Bashenow, CLHMS, is a luxury real estate advisor with The DeBoor Group powered by Real Broker and a former high-value residential appraiser with Chubb.